Ticket Size Analysis: Q2 2026 activity was strongest at the extremes of the ticket-size distribution. Micro deals below $2.5M rose from 29% to 48% of disclosed transactions. Mega deals above $75M rose from 19 to 24 in absolute terms. The mid-market ($2.5M to $75M) fell from 54% to 37%. The report analyses what this signals about underlying market depth and investor composition.
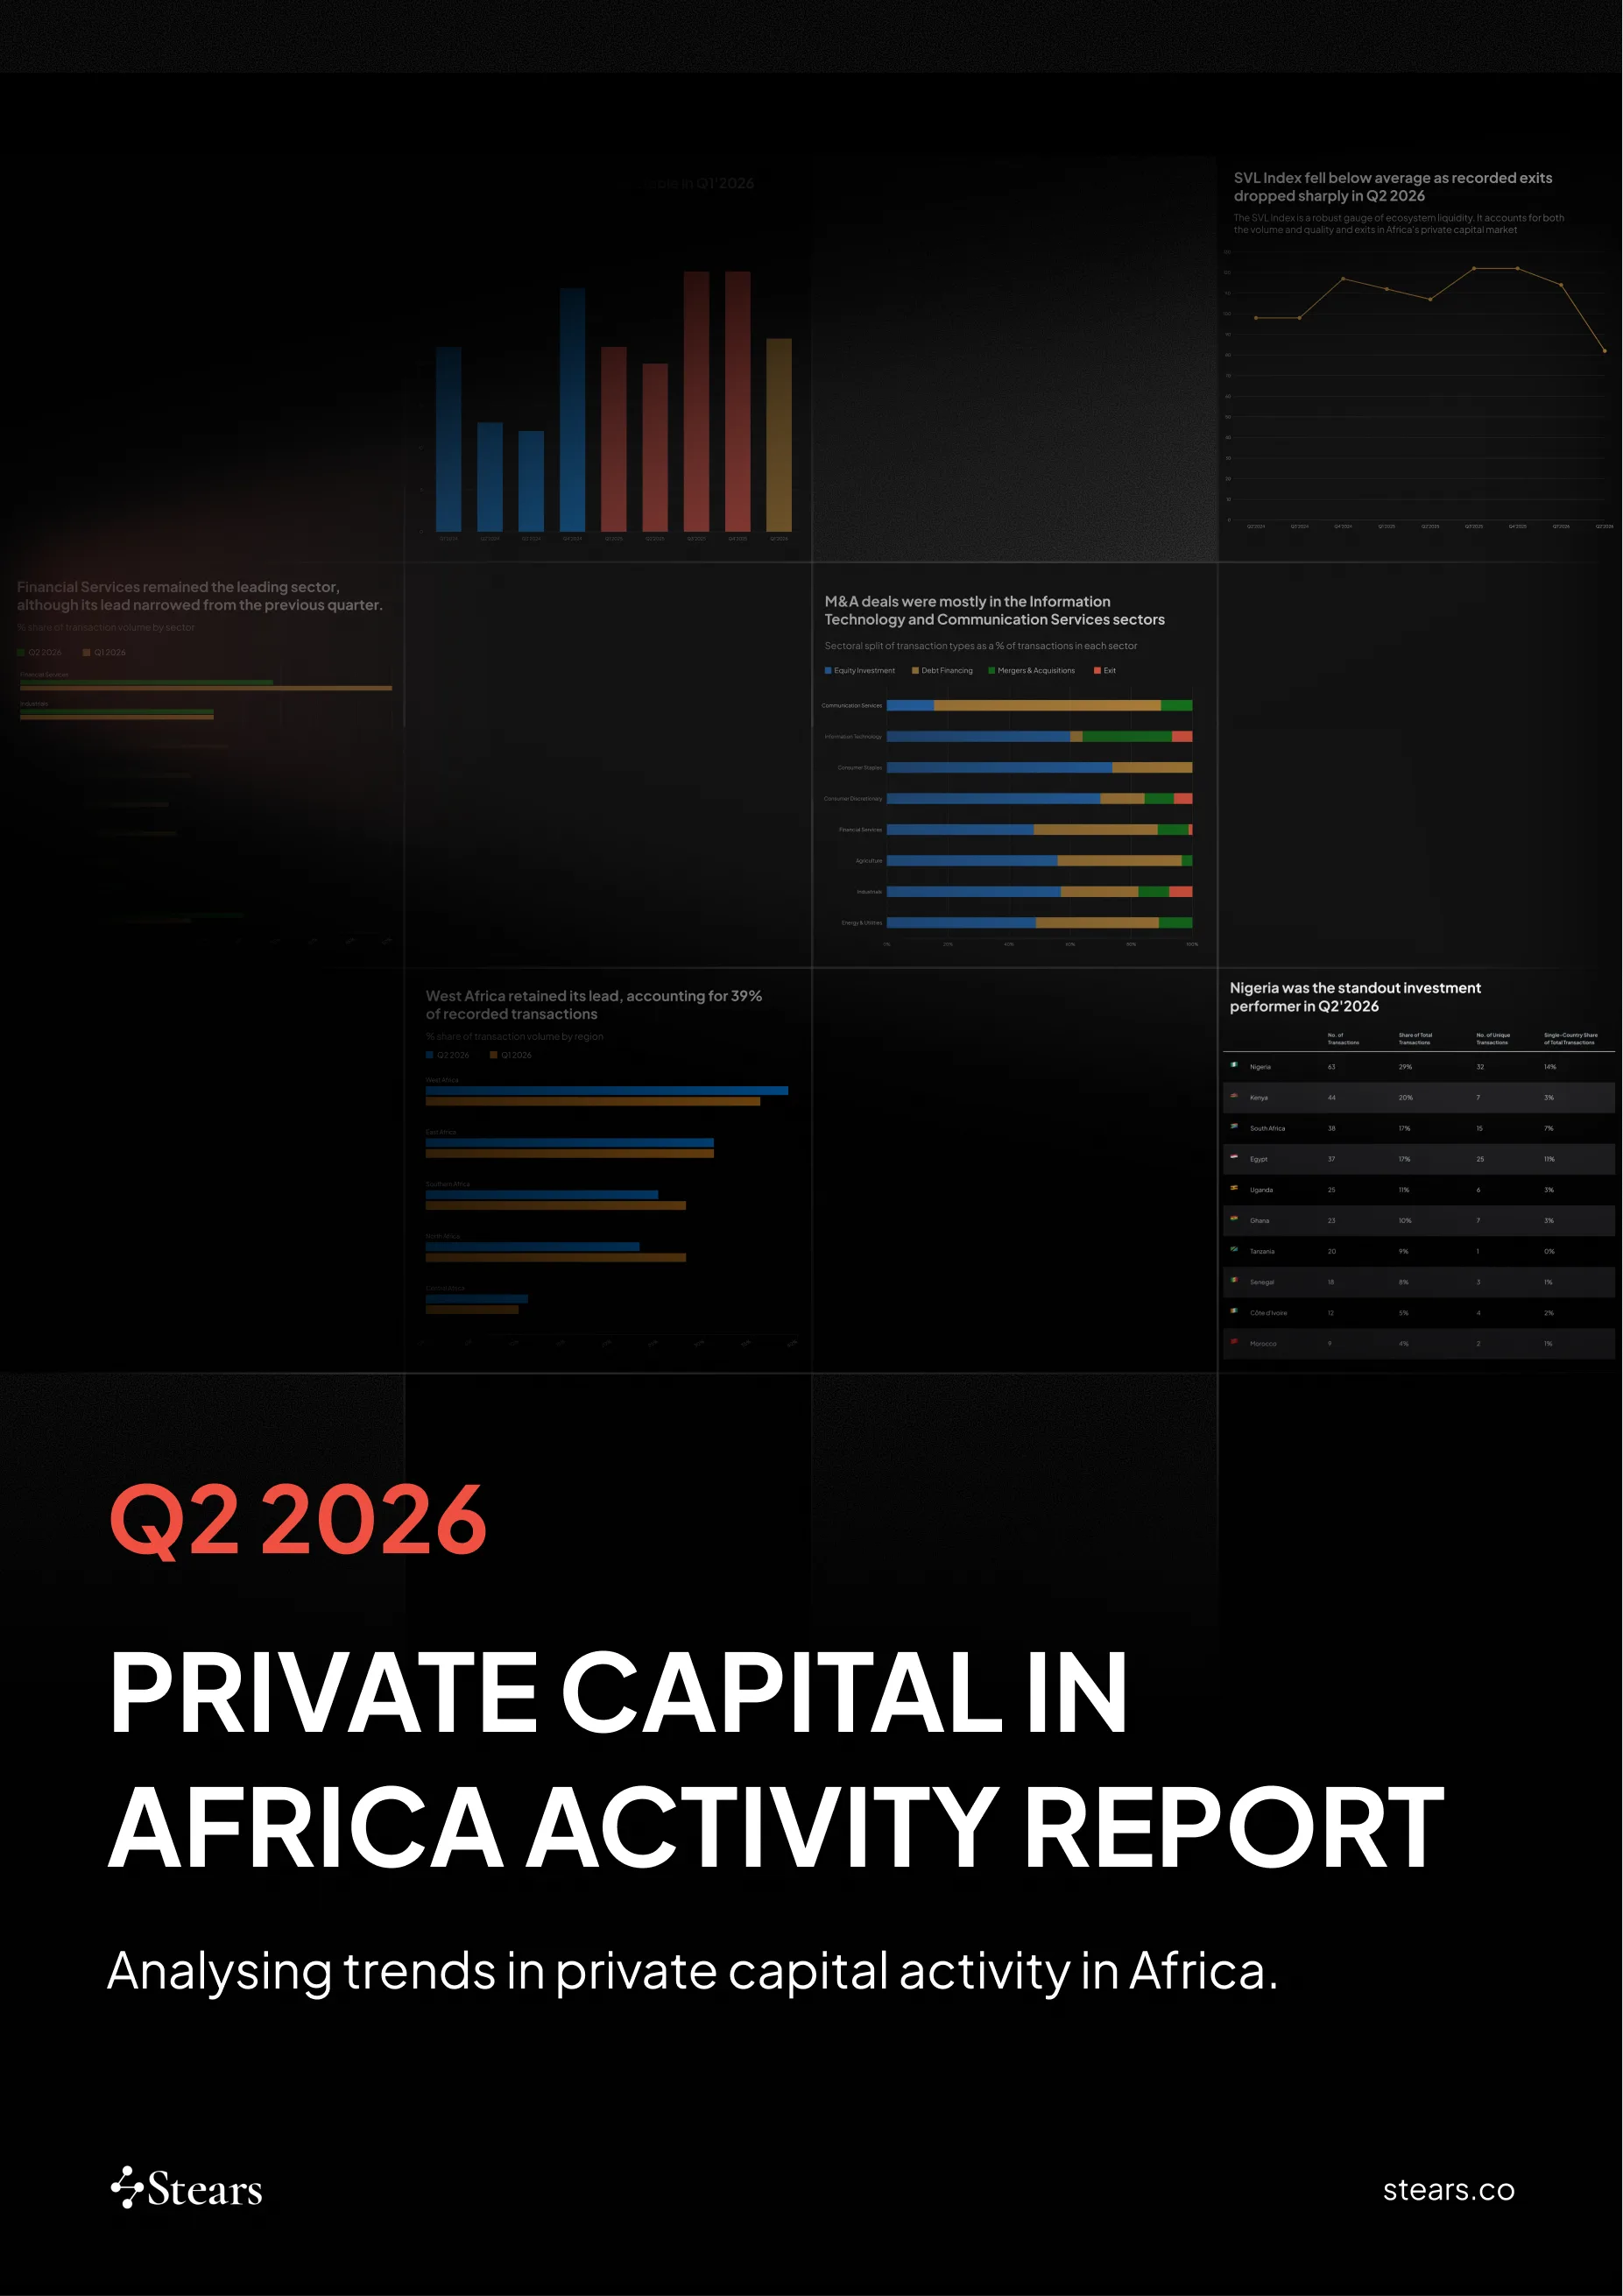
Mergers and Acquisitions: M&A represented 14% of recorded transactions in Q2 2026, down from 24% in Q1, with disclosed value declining to $2.9B from $6.9B. The largest deal was the $2.7B acquisition of Payoneer by a group led by Nuvei Corporation. Three AI acquisitions also featured: BlueChip Technologies/YarnGPT, CNTXT AI/Actualize, and Yoco/Dynai.ai, signalling a shift from AI investment to platform consolidation.
Exit Analysis and the SVL Index: Q2 2026 recorded seven exits, the lowest quarterly count since Q4 2022. The SVL Index fell to 82.46, below the long-run average of 100 and down from 114.37 in Q1 2026. The decline was driven by exit volume rather than a broad deterioration across liquidity indicators. The quarter's most notable exit, Beltone Venture Capital and Citadel's exit from Bosta, generated a 75% IRR.
Investor League Table: ISFD and the Islamic Development Bank led transaction count with 36 each, driven by the Tadamon Accelerator for Food Security grant programme. By disclosed value, Standard Bank Group ($1.7B), IFC ($966M), and AfDB ($636M) anchored the aggregate. The report provides the full league table, separating volume leaders from capital deployers.
Sectoral Insights: Financial Services led with 52 transactions and $6.7B in disclosed value, though its share fell from 50% to 34% as activity broadened. Within the sector, Payments Infrastructure accounted for $3.0B, equivalent to 28% of total disclosed value. The report covers sub-sector breakdowns, transaction type splits, and year-on-year comparisons
Regional Dynamics and Country Insights: West Africa led by volume (39%) and value ($8.9B), with Nigeria contributing $8.0B of the regional total. East Africa ranked second, Southern Africa third, North Africa fourth. Egypt led North Africa with 37 transactions and the highest single-country concentration at 68%. Kenya recorded 44 transactions but only 7 single-country deals (16%), reflecting a deal base tied to regional platforms. Country-level breakdowns cover Nigeria, Kenya, South Africa, Egypt, Uganda, Ghana, Senegal, Côte d'Ivoire, and Morocco.